I subscribe to the Chef blog in my RSS reader, The Old Reader, so that I can stay up to date with recent releases and changes happening in the community and in the various software projects that make up, “Chef.” Recently, I saw the release announcement for chef-client 12.6.0. I scrutinize these especially closely, as they’re an easy way to follow along with major upcoming changes that I might encounter.
One particular feature that stuck out in the release notes was a new option, [shell]–profile-ruby[/shell].
New –profile-ruby option
You like to go fast and so do we. The ‘chef’ gem now has new optional development support for profiling Ruby. When invoked, this option will dump a profiling graph that can be used to determine and resolve performance bottlenecks with chef-client runs.
It turns out the new feature, added by Lamont Granquist in this initial commit, uses the ruby-prof gem to generate a report that shows where time was spent during the Chef run. After creating a pull request to add a configuration option in Test-Kitchen for the profiling feature, I took a look at where most time was spent in a Chef run converging the elasticsearch cookbook.
Using my patched version of test-kitchen, I enabled the profiling option for the chef_zero provisioner:
[generic]
provisioner:
name: chef_zero
profile_ruby: true
[/generic]
Then, I ran a fresh [shell]kitchen test[/shell], and saw the following message in the output:
[generic]
Chef Client finished, 23/56 resources updated in 01 minutes 20 seconds
[2016-01-02T17:50:33+00:00] WARN: Ruby execution profile dumped to /tmp/kitchen/cache/graph_profile.out
Finished converging
[/generic]
And here’s what I found at the top of [shell]/tmp/kitchen/cache/graph_profile.out[/shell] on that instance:
[generic]
Measure Mode: wall_time
Thread ID: 13693940
Fiber ID: 24968380
Total Time: 80.0750961303711
Sort by: total_time
[/generic]
Given that the entire run took slightly more than 1.5 minutes, 80 seconds seems like a very reasonable number for the total timing. Below that header, there’s also specific details showing how much time was spent in each method. I had to pull some of the explanation from the ruby-prof gem to really understand what I was seeing:
Dashed lines divide the report into entries, with one entry per method. Entries
are sorted by total time which is the time spent in the method plus its
children.Each entry has a primary line demarked by values in the %total and %self
columns. The primary line represents the method being profiled. Lines above it
are the methods that called this method (parents) while the lines below it are
the methods it called (children).
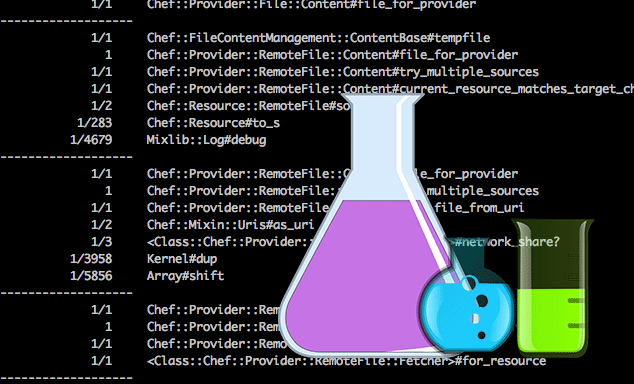
In my case, here’s what the logs showed:
[generic]
64.619 0.000 0.000 64.619 1/1 Chef::Provider::RemoteFile::Content#grab_file_from_uri
80.70% 0.00% 64.619 0.000 0.000 64.619 1 Chef::Provider::RemoteFile::HTTP#fetch
64.473 0.000 0.000 64.472 1/1 Chef::HTTP#streaming_request
0.145 0.000 0.000 0.145 1/1 Chef::Provider::RemoteFile::HTTP#update_cache_control_data
0.001 0.000 0.000 0.001 1/1 Chef::Provider::RemoteFile::HTTP#headers
0.000 0.000 0.000 0.000 1/1 Chef::Provider::RemoteFile::HTTP#http_client_opts
0.000 0.000 0.000 0.000 1/30899 Class#new
0.000 0.000 0.000 0.000 1/15 Tempfile#close
0.000 0.000 0.000 0.000 1/1 Chef::HTTP#last_response
[/generic]
In short, 80% of my chef run was spent in [ruby]Chef::Provider::RemoteFile::HTTP#fetch[/ruby], almost 65 seconds worth. This makes sense, since the cookbook’s longest task is downloading the package file to install it. While this may seem trivial, it’s hugely useful to see where the time is being spent, especially given that the only other way to do this currently is timestamps.
Ruby-prof also supports fancy HTML visualizations of time spent in the call stack, though these are not supported in the chef-client (yet!):
Kudos to Lamont on this cool feature!