NewRelic quietly released a new product called Synthetics earlier this year. While services like Pingdom have been around for a while, New Relic’s Synthetics has been the first option that made me actually shut down my own personal monitoring systems.
For the last five years or so, I’ve been monitoring everything, from websites I run to internet services at rental property. I generally used Nagios, and configured it to alert me via email when things go south. The data has always been a help when dealing with power companies, ISPs, and hosting providers. You feel empowered when you can say things like, “I had packet loss 24 times yesterday,” or, “The power has been surging every 2 hours for 30 seconds.” In fact, I’ve discovered I generally have better data than the customer service folks I’m speaking with.
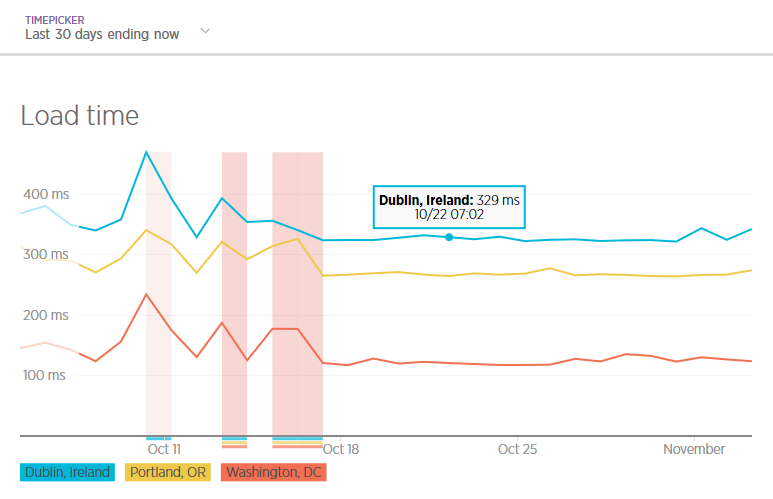
In a recent issue with my local ISP, I was able to show them graphs and outages I’d never have been able to produce with my previous Nagios setup:
And the best part is, New Relic gives you 50 monitors on Synthetics for free. This actually makes it cheaper than running my own cloud servers. And with 10+ different locations you can monitor from, it’s actually way more than I was doing myself. Once I saw something that was (a) free and (b) had gorgeous graphs, I was set. I deleted my monitoring system cloud servers as soon as I’d configured everything in New Relic.
It can do HTTP monitors by default, and if you’re willing to pay, it can do much much more, from RESTful API calls to synthetic browser page loads. I’d highly recommend it for monitoring internet connections on the cheap. And you’ll be able to show your less-technical housemates their SLA in a nice dashboard:
I’m also using Synthetics with the New Relic Alerts Beta, which lets me do high level incident management of all of my outages too. This comes in super-handy when I’m monitoring more than one entity in the same failure domain (common when doing internet connection monitoring or hosting lots of sites under shared hosting).


